算子开发常见问题
核函数运行验证时算子存在精度问题
现象描述
在进行算子NPU域的运行验证时,通过md5sum等方式进行算子精度比对,实际数据和真值数据不一致,算子存在精度问题。本示例中通过md5sum来进行精度比对,打印出的真值数据和实际输出数据的md5值不一致,具体打印信息如下。
md5sum:
45e17ee4c068a655be2af4d8c3a1f191  output/golden.bin
6a99e41a84b14dd04f32730ceb9a3988  output/output_y.bin
问题根因
算子出现精度问题,一般是由于算子的实现逻辑有误。
定位步骤
AscendC提供孪生调试的功能,通过CPU域的功能验证、gdb单步调试、printf数值打印来定位算子的实现逻辑问题。本样例仅展示了可能会出现的场景,便于演示定位步骤。实际使用过程中,请根据代码情况进行调试。
-
进行CPU域的功能验证,观察是否有日志报错。
参考工程化算子开发章节,编写CPU侧的运行验证代码,并进行运行验证。得到CPU域的精度比对结果如下。
md5sum:45e17ee4c068a655be2af4d8c3a1f191 output/golden.bin5d6e1aec686b28bd3839dbcd5caaa8b2 output/output_y.bin可以看出CPU域的精度比对也存在不一致的问题,然后观察是否有打屏日志报错,可搜索关键词"failed"。比如,下图的报错示例指示,错误出现在代码中调用LeakyRelu接口的地方。
leakyrelu_custom_cpu: /home/workdir/AscendC/ddk/tikcpp/tikcfw/interface/kernel_operator_vec_binary_scalar_intf.h:447: void AscendC::LeakyRelu(const AscendC::LocalTensor<T>&, const AscendC::LocalTensor<T>&, const T&, const int32_t&) [with T = float16::Fp16T; int32_t = int]: Assertion `false && "check vlrelu instr failed"' failed通过上述报错日志,一般只能定位到报错的代码行,无法明确具体错误,接下来需要通过gdb调试的方式或者printf打印的方式进一步精确定位。
-
gdb调试。下面的样例展示了拉起leakyrelu算子CPU侧运行程序的样例,该样例程序会直接抛出异常,直接gdb运行,查看调用栈信息分析定位即可。其他场景下开发者可以使用gdb打断点等基本操作进行调试。使用gdb调试AscendC程序的详细内容请参考gdb调试。
-
使用gdb拉起待调试程序,进入gdb界面进行debug。
gdb leakyrelu_custom_cpu -
单独调试一个子进程。
(gdb) set follow-fork-mode child -
运行程序。
(gdb) r -
通过bt查看程序调用栈。
(gdb) bt -
查看具体层的堆栈信息,打印具体变量的值。本示例中,打印了tileLength为1024,该程序中表示需要处理1024个half类型的数,大小为1024*sizeof(half)=2048字节;输入Tensor xLocal的值,其中dataLen表示LocalTensor的size大小为1024字节,只能计算1024字节的数据。可以看出两者的长度不匹配,由此可以定位问题。
(gdb) f 5#5 0x000055555555d364 in KernelLeakyRelu::Compute (this=0x7fffffffd7d0, progress=0) at /root/AscendC_DemoCode-master/precision-error/vector/leakyrelu_custom.cpp:5959 LeakyRelu(yLocal, xLocal, scalar, tileLength);(gdb) p tileLength$1 = 1024(gdb) p xLocal$1 = {<AscendC::BaseTensor<float16::Fp16T>> = {<No data fields>}, address_ = {logicPos = 9 '\t', bufferHandle = 0x7fffffffd930 "\003\005\377\377", dataLen = 1024,bufferAddr = 0,absAddr = ...}
-
-
printf打印。在合适的位置增加变量打印。样例代码如下。
printf("xLocal size: %d\n", xLocal.GetSize());printf("tileLength: %d\n", tileLength);可以看到有如下打屏日志输出,打印了tileLength为1024,该程序中表示需要处理1024个half类型的数;输入Tensor xLocal的size大小,为512,表示只能计算512个half类型的数。可以看出两者的长度不匹配,由此可以定位问题。
xLocal size: 512tileLength: 1024
kernel侧获取Tiling信息不正确
现象描述
通过算子在kernel侧实现代码中添加PRINTF打印发现kernel侧获取的Tiling信息不正确。
比如下文样例,增加的打印代码如下。
PRINTF("tiling_data.totalLength: %d tiling_data.tileNum: %d.\n", tiling_data.totalLength, tiling_data.tileNum);
打印的Tiling数据如下,全为0:
tiling_data.totalLength: 0 tiling_data.tileNum: 0.
问题根因
kernel侧获取Tiling信息不正确的原因一般有以下两种:
- host侧计算Tiling的逻辑不正确
- kernel侧核函数的参数未按照正确顺序填写
处理步骤
-
参考如下示例,打印TilingData的数据,确认host侧序列化保存的TilingData是否正确。如果此时打印值有误,说明Tiling的计算逻辑可能不正确,需要进一步检查host侧Tiling实现代码,排查计算逻辑是否有误。
// 按照实际数据类型打印TilingData第一个参数值,如需确认其他值,取值指针向后偏移即可std::out<<*reinterpret_cast<uint32_t *>(context->GetRawTilingData()->GetData())<<std::endl; -
如果上一步骤中打印的TilingData正确,需要排查kernel侧核函数的参数是否按照正确顺序填写。
使用msOpGen工具创建算子工程,并基于工程进行kernel侧算子开发时,核函数的定义模板已通过msOpGen工具自动生成,样例如下所示 。 参数按照 “输入、输出、workspace、tiling”的顺序排布。请检查是否调整过参数顺序导致和正确顺序不一致。
#include "kernel_operator.h"extern "C" __global__ __aicore__ void add_custom(GM_ADDR x, GM_ADDR y, GM_ADDR z, GM_ADDR workspace, GM_ADDR tiling) {GET_TILING_DATA(tiling_data, tiling);// 获取Tiling参数// TODO: user kernel impl}
Kernel编译时报错“error: out of jump/jumpc imm range”
现象描述
使用工程化算子开发方式,基于自定义算子工程进行算子开发。编译算子时失败,报如下错误:
[ERROR] [ascendxxxx] PowerCustom_88a695f03edfbc0af76b9eaae9e4556c error: out of jump/jumpc imm range
问题根因
该编译错误的原因是算子kernel代码过大,导致在编译时跳转指令跳转的偏移值超过了限定的大小(int16_t的数据范围),可通过添加编译选项“-mllvm -cce-aicore-jump-expand=true”通过间接跳转的方式来避免该问题,让编译器能够正常编译。
处理步骤
-
在kernel侧的CMakeLists中通过add_ops_compile_options针对报错算子添加编译选项“-mllvm -cce-aicore-jump-expand=true”,示例如下。
add_ops_compile_options(PowerCustom OPTIONS -mllvm -cce-aicore-jump-expand=true)add_ops_compile_options的具体使用方法请参考支持自定义编译选项。
-
重新编译该算子。正常编译无报错。
有可选输入的情况下,算子编译失败,报找不到DTYPE_XX
现象描述
使用tilingkey设置代码分支时,无法生成对应omc文件。例如onnx模型为2个输入,算子有4个输入x、y、m、n,2个为required和2个optional,tiling key设置为2。
class KernelAddCustom_omc2 {
// ... ...
};

class KernelAddCustom_omc3 {
// ... ...
};

class KernelAddCustom_omc4 {
public:
    __aicore__ inline KernelAddCustom_omc4() {}
    __aicore__ inline void Init4(GM_ADDR x, GM_ADDR y, GM_ADDR m, GM_ADDR n, GM_ADDR z, uint32_t totalLength, uint32_t tileNum)
    {
        ASSERT(GetBlockNum() != 0 && "block dim can not be zero!");
        this->blockLength = totalLength / GetBlockNum();
        this->tileNum = tileNum;
        ASSERT(tileNum != 0 && "tile num can not be zero!");
        this->tileLength = this->blockLength / tileNum / BUFFER_NUM;

        xGm.SetGlobalBuffer((__gm__ DTYPE_X*)x + this->blockLength * GetBlockIdx(), this->blockLength);
        yGm.SetGlobalBuffer((__gm__ DTYPE_Y*)y + this->blockLength * GetBlockIdx(), this->blockLength);
        mGm.SetGlobalBuffer((__gm__ DTYPE_M*)m + this->blockLength * GetBlockIdx(), this->blockLength);
        nGm.SetGlobalBuffer((__gm__ DTYPE_N*)n + this->blockLength * GetBlockIdx(), this->blockLength);
        zGm.SetGlobalBuffer((__gm__ DTYPE_Z*)z + this->blockLength * GetBlockIdx(), this->blockLength);
        pipe.InitBuffer(inQueueX, BUFFER_NUM, this->tileLength * sizeof(DTYPE_X));
        pipe.InitBuffer(inQueueY, BUFFER_NUM, this->tileLength * sizeof(DTYPE_Y));
        pipe.InitBuffer(inQueueM, BUFFER_NUM, this->tileLength * sizeof(DTYPE_M));
        pipe.InitBuffer(inQueueN, BUFFER_NUM, this->tileLength * sizeof(DTYPE_N));
        pipe.InitBuffer(outQueueZ, BUFFER_NUM, this->tileLength * sizeof(DTYPE_Z));
    }
// ... ...
private:
    TPipe pipe;
    TQue<QuePosition::VECIN, BUFFER_NUM> inQueueX, inQueueY, inQueueM, inQueueN;
    TQue<QuePosition::VECOUT, BUFFER_NUM> outQueueZ;
    GlobalTensor<DTYPE_X> xGm;
    GlobalTensor<DTYPE_Y> yGm;
    GlobalTensor<DTYPE_M> mGm;
    GlobalTensor<DTYPE_N> nGm;
    GlobalTensor<DTYPE_Z> zGm;
    uint32_t blockLength;
    uint32_t tileNum;
    uint32_t tileLength;
};


extern "C" __global__ __aicore__ void add_custom_omc(GM_ADDR x, GM_ADDR y, GM_ADDR m, GM_ADDR n, GM_ADDR z, GM_ADDR workspace, GM_ADDR tiling) {
    GET_TILING_DATA(tiling_data, tiling);
    if (TILING_KEY_IS(2)){
        KernelAddCustom_omc2 op;
        op.Init2(x, y, z, tiling_data.size, 4);
        op.Process2();
    } else if (TILING_KEY_IS(3)){
        KernelAddCustom_omc3 op;
        op.Init3(x, y, m, z, tiling_data.size, 4);
        op.Process3();
    }else if (TILING_KEY_IS(4)){
        KernelAddCustom_omc4 op;
        op.Init4(x, y, m, n, z, tiling_data.size, 4);
        op.Process4();
    }
}
omg模型转换失败,报错如下。
ddk/ascendc/ops/impl/custom/add_custom_omc.cpp:165:37: error: unknown type name 'DTYPE_N'
        nGm.SetGlobalBuffer((__gm__ DTYPE_N*)n + this->blockLength * GetBlockIdx(), this->blockLength);
                                    ^
ddk/ascendc/ops/impl/custom/add_custom_omc.cpp:169:73: error: use of undeclared identifier 'DTYPE_M'
        pipe.InitBuffer(inQueueM, BUFFER_NUM, this->tileLength * sizeof(DTYPE_M));
                                                                        ^
问题根因
模型仅有2个输入x、y的情况下,仅会生成对应的宏DTYPE_X、DTYPE_Y,不会生成DTYPE_M,DTYPE_N。
处理步骤
通过编译宏隔离:
#if defined (DTYPE_M) && defined (DTYPE_N)
class KernelAddCustom_omc4 {
// ... ...
};
#endif
如何通过gdb启动算子调测工具脚本
问题描述
在Linux环境下,开发者需要通过gdb方式开启对算子调测(ascendebug)工具的调试。
可能的原因
无
处理方案
-
执行如下命令,获取工具安装路径。
which ascendebug
一般情况下,ascendebug工具路径缺省为“{INSTALL_DIR}/tools/tools_ascendc/package/ascendebug”,其中${INSTALL_DIR}请替换为DDK软件安装后文件存储路径。
-
打开ascendebug工具启动脚本(以缺省路径为例)。
vim ${INSTALL_DIR}/tools/tools_ascendc/package/ascendebug -
在启动脚本中添加gdb调试命令。
样例如下。
main() {check_env $LD_LIBRARY_PATHret1=$?check_env $PATHret2=$?check_env $TOOLCHAIN_HOMEret3=$?if [ $ret1 -eq 1 ] || [ $ret2 -eq 1 ] || [ $ret3 -eq 1 ]; thenecho "Please make sure source the correct cann package setenv.bash only. you can open a new window,and restart"exit 0fiexport _ASCENDC_DEBUG_TOOL_INSTALL_PATH=${DIR%%latest*}gdb --ex r --args python3 -m ascendebug.cmd $@}
环境变量报错提示there are multiple xxx env variable
问题描述
使用本工具进行算子功能调测时失败,提示的报错信息如下。
error: User specified two different cann Installation package path: {PATH_A} and {PATH_B}
error: User specified two different cann Installation package path: {PATH_A} and {PATH_B}
error: User specified two different cann Installation package path: {PATH_A} and {PATH_B}
Please make sure source the correct cann package setenv.bash only. you can open a new window,and restart
可能的原因
重复设置了环境变量。
处理方案
- 检查当前运行环境中的环境变量(缺省路径为${INSTALL_DIR}/ddk/tools/tools_ascendc/set_ascendc_env.sh)是否有重复设置。
- 如果有重复,重新打开一个终端窗口,按照环境准备章节设置环境变量。
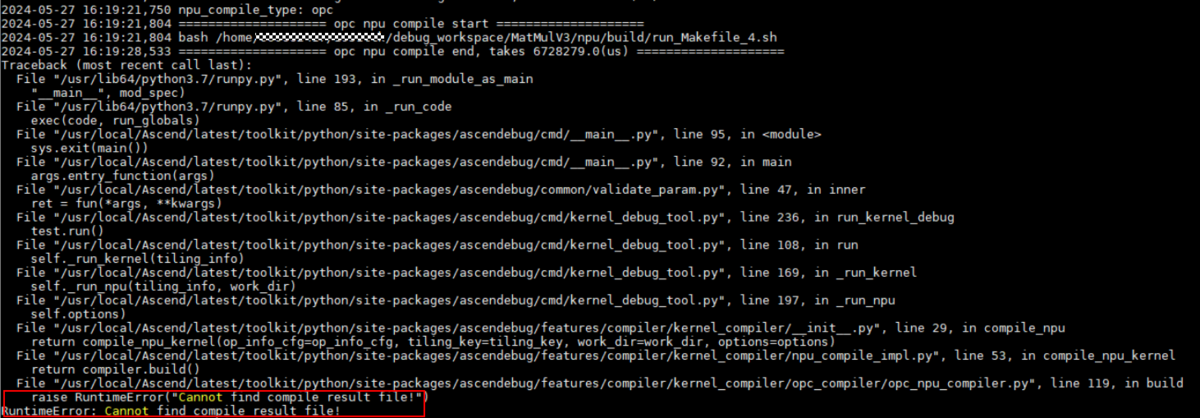
NPU编译失败提示RuntimeError: Cannot find compile result file
问题描述
opc编译方式下,kernel编译报错,如图1所示。
图1 报错样例
可能的原因
Kernel代码实现有误,导致编译失败。
处理方案
-
设置环境变量。
在任意终端窗口打开ascendc环境变量文件,缺省路径为“${INSTALL_DIR}/tools/tools_ascendc/set_ascendc_env.sh”,设置如下变量,放开日志打印等级:
export ASCEND_GLOBAL_LOG_LEVEL=3 # 设置日志级别为ERRORexport ASCEND_SLOG_PRINT_TO_STDOUT=1 # 开启日志打屏,日志将不会保存在log文件中 -
获取日志文件。
通过命令行方式,日志落盘地址由Simulator仿真参数接口指定,缺省为当前操作路径的debug_op.log。请根据实际路径打开日志文件。
-
截取调测命令,重新执行后再分析。
-
在debug_op.log中找到“opc npu compile start”关键字。
-
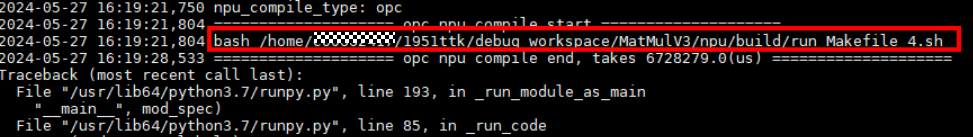
手动拷贝opc npu compile start后的命令,如图2所示,并在终端窗口执行,通过打屏或者落盘的日志文件进一步分析问题。
图2 NPU编译命令
-
NPU编译失败提示RuntimeError: Cannot get compiling bash file! Maybe template json does not match
问题描述
opc编译方式下,kernel编译报错,如图3所示。
图3 报错样例
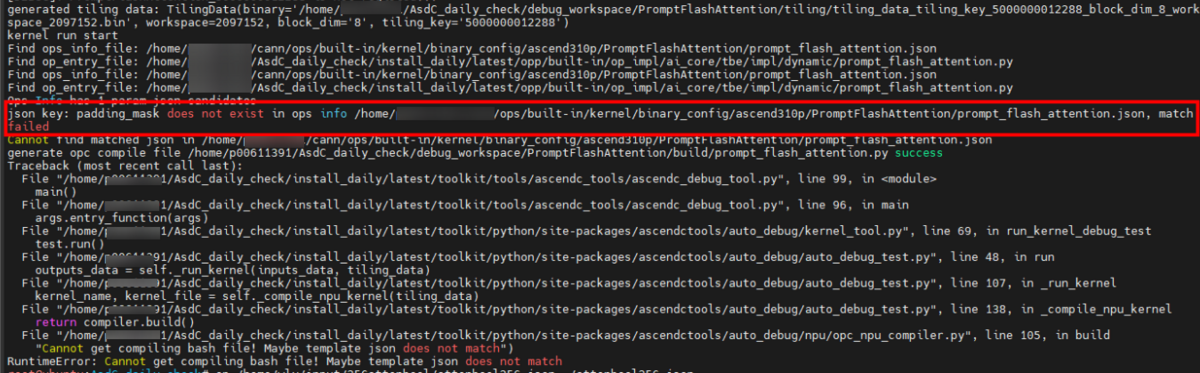
可能的原因
开发者输入的算子json配置文件与自定义算子工程的算子json模板配置不一致(如输入/输出的dtype不一样)。
处理方案
若调试的算子json模板可变更:
修改开发者输入的算子json配置文件,使其与自定义算子工程的算子json模板配置保持一致。
例如图3 报错样例中,将json中的padding_mask改为模板对应的pse_shift。
调测失败提示RuntimeError: run output data xxx not found
问题描述
执行Kernel显示结束,但最后报错提示没有找到output输出文件。
可能的原因
CPU/Simulator的Kernel执行失败,导致输出路径下无输出文件生成。
处理方案
-
设置环境变量。
在任意终端窗口打开ascendc环境变量文件,缺省路径为“${INSTALL_DIR}/tools/tools_ascendc/set_ascendc_env.sh”,设置如下变量,放开日志打印等级:
export ASCEND_GLOBAL_LOG_LEVEL=3 # 设置日志级别为ERRORexport ASCEND_SLOG_PRINT_TO_STDOUT=1 # 开启日志打屏,日志将不会保存在log文件中 -
获取日志文件。
通过命令行方式,日志落盘地址由NPU调测参数接口指定,缺省为当前操作路径的debug_op.log。请根据实际路径打开日志文件。
-
截取CPU/Simulator调测命令,重新执行后再分析。
- 在debug_op.log中找到“cpu kernel run start”或“npu kernel run start”关键字。
- 手动拷贝关键字后的所有命令,在终端窗口分别执行,通过打屏或者落盘的日志文件信息进一步分析问题。
[CONSOLE] ascendc_debug_tool [3626213] 2024-05-21 19:15:35,513 ==================== cpu kernel run start ====================[CONSOLE] ascendc_debug_tool [3626213] 2024-05-21 19:15:35,513 execute_cmd: bash -c "cd /home/ascendebug_smoking_test/op_contrib/api_opcontrib_case/ForeachSigmoid/cpu/build && ./foreach_sigmoid_cpu | tee -a /home/ascendebug_smoking_test/op_contrib/api_opcontrib_case.log && cd -"cpu run start[CONSOLE] ascendc_debug_tool [3626213] 2024-05-21 19:15:36,046 ==================== npu kernel run start ====================[CONSOLE] ascendc_debug_tool [3626213] 2024-05-21 19:15:36,046 /home/run_pkg/latest/toolkit/tools/ascendc_tools/npu_kernel_launch/npu_kernel_launch --kernel /home/ascendebug_smoking_test/op_contrib/data/op-contrib/build_out/binary/${chip_version}/bin/foreach_sigmoid/ForeachSigmoid_0885a6586f8e7f8dc8d03c4dabc73ef4_high_performance.o --name ForeachSigmoid --json_file /home/ascendebug_smoking_test/op_contrib/api_opcontrib_case/ForeachSigmoid/data/ForeachSigmoid.json --input_path /home/ascendebug_smoking_test/op_contrib/api_opcontrib_case/ForeachSigmoid/data --output_path /home/ascendebug_smoking_test/op_contrib/api_opcontrib_case/ForeachSigmoid/npu/output --tiling_data /home/ascendebug_smoking_test/op_contrib/api_opcontrib_case/ForeachSigmoid/tiling/tiling_data_tiling_key_1_block_dim_1_workspace_33554432.bin --tiling_key 1 --workspace 33554432 --block_dim 1 --timeout 600 --device 0 --core_type VectorCore --arg_lib /home/ascendebug_smoking_test/op_contrib/api_opcontrib_case/ForeachSigmoid/npu/build/launch_args.sokernel name: ForeachSigmoidkernel file: /home/ascendebug_smoking_test/op_contrib/data/op-contrib/build_out/binary/${chip_version}/bin/foreach_sigmoid/ForeachSigmoid_0885a6586f8e7f8dc8d03c4dabc73ef4_high_performance.ojson file: /home/ascendebug_smoking_test/op_contrib/api_opcontrib_case/ForeachSigmoid/data/ForeachSigmoid.json// ...
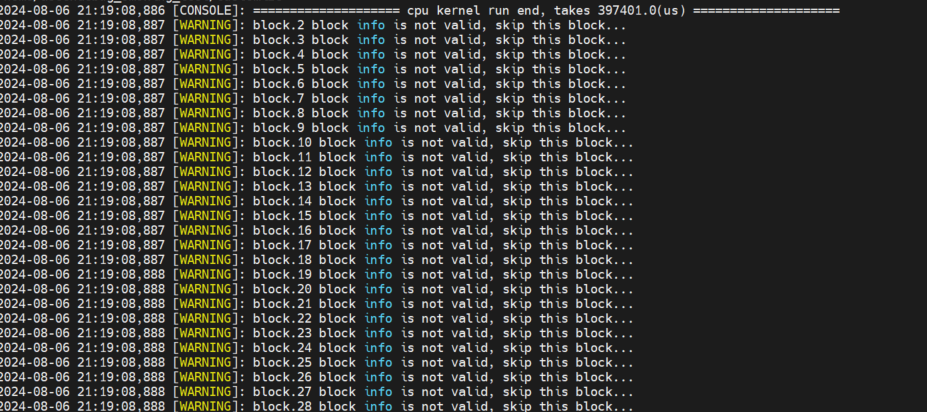
使能打印功能后提示block info is not valid, skip this block
问题描述
开启printf/PRINTF/DumpTensor/DumpAccChkPoint/assert打印功能后,代码执行出现block info is not valid, skip this block,无打印信息。
可能的原因
打印DumpTensor的代码未在报错核中执行 (以CPU调测为例,如图4所示,block32~70 的核没有执行Dump和Print操作),后续解析对应.bin时无法获取该核对应的数据,因此该block的数据无效,打印跳过。
图4 报错样例
处理方案
请自行检查算子实现代码,确保printf/PRINTF/DumpTensor/DumpAccChkPoint/assert已执行到该核中。
调试Kernel代码时打印错误或者无打印信息
问题描述
调试Kernel代码时虽开启了打印功能,但无论如何修改代码,总是打印错误甚至无打印。
可能的原因
- 算子Kernel代码执行过程中异常退出,无打印信息。
- 上一次执行日志未清理,真值比对和Dump解析模块按照其路径读取了残留文件,输出了错误的值。
处理方案
-
先清理系统中残留的日志文。
请根据实际情况清理上一次生成的调测结果目录(由--work-dir参数指定),包括落盘的日志文件(缺省为当前操作路径的debug_op.log)。
-
重新进行CPU/Simulator调测。
-
查看最新生成的日志文件,根据提示的warning、error日志进一步分析问题。
CPU/Simulator调测的精度比对结果部分为0
问题描述
CPU/Simulator调测生成的精度比对结果文件出现“Failed”,部分输出为0,结果如图5所示。
图5 精度比对结果文件
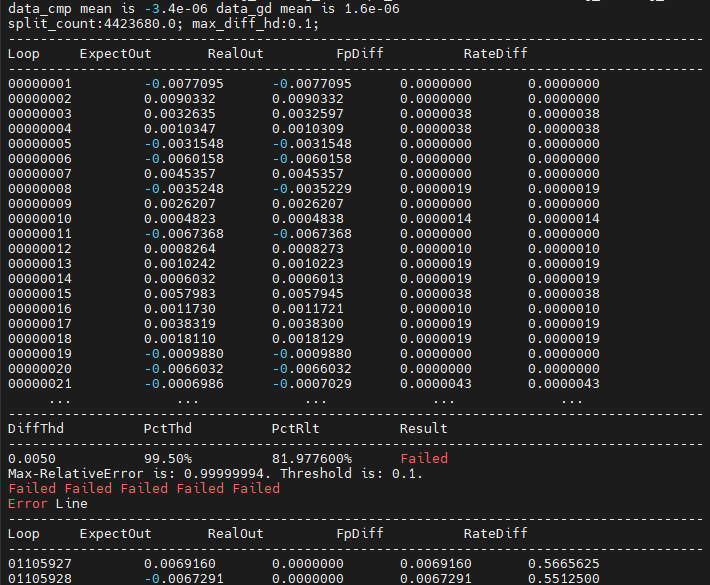
可能的原因
算子指定的block num没有跑满,导致部分输出为0。
处理方案
检查Tiling文件中设置的block num或者检查--block-num参数配置是否合理,请保证该值满足算子计算业务的需求。
如何通过查看Tiling日志定位问题
问题描述
Tiling调测过程中提示报错,需要通过日志进一步定位问题。
可能的原因
Tiling函数代码实现有误或者输入配置有误(如数据、算子json配置文件等)。
处理方案
-
获取日志文件。
通过命令行方式,日志落盘地址由NPU调测参数接口指定,缺省为当前操作路径的debug_op.log。请根据实际路径打开日志文件。
-
截取Tiling调测命令,重新执行,根据提示进一步定位Tiling代码问题。
- 在debug_op.log中找到“gen_tiling_data_cmd”关键字。
- 手动拷贝gen_tiling_data_cmd后的所有命令,在终端窗口执行,通过打屏或者落盘的日志文件进一步分析问题。
执行命令之前,请确保当前终端环境准备设置并生效。
[CONSOLE] ascendc_debug_tool [4149480] 2024-06-03 15:57:42,364 ==================== generate tiling data start ====================[CONSOLE] ascendc_debug_tool [4149480] 2024-06-03 15:57:42,364 gen_tiling_data_cmd:/home/install_daily/latest/toolkit/tools/ascendc_tools/ascendc_tiling_tool /home/install_daily/latest/opp/built-in/op_impl/ai_core/tbe/op_tiling/lib/linux/aarch64/liboptiling.so FlashAttentionScore ${chip_version} /home/ascendebug_smoking_test/ops_adv/adt_biprof/FlashAttentionScore/tiling/tiling_data.bin /home/ascendebug_smoking_test/ops_adv/adt_biprof/FlashAttentionScore/tiling/tiling_run_info.bin /home/ascendebug_smoking_test/ops_adv/adt_biprof/FlashAttentionScore/tiling/inputs.json /home/ascendebug_smoking_test/ops_adv/adt_biprof/FlashAttentionScore/tiling/outputs.json /home/ascendebug_smoking_test/ops_adv/adt_biprof/FlashAttentionScore/tiling/attrs.json[CONSOLE] ascendc_debug_tool [4149480] 2024-06-03 15:57:42,917 ==================== generate tiling data end, takes 552974.0(us) ====================
CAModel仿真过慢导致运行失败
问题描述
使用CAModel进行算子性能仿真时,发现运行时间较长,直至调测失败。
可能的原因
- 硬件资源有限,多任务抢占资源,导致CAModel运行缓慢。
- 硬件性能不足以支撑算子仿真计算。
- 算子的输入/输出Shape过大,导致CAModel仿真耗时激增。
- CAModel仿真参数设置不合理,如block num取值过大。
处理方案
-
建议1:尽可能避免多个任务同时抢占硬件资源,保障CAModel主任务运行效果。
-
建议2:提高硬件性能,尽量满足如下要求:
- 服务器:X86物理服务器或者计算云(暂支持x86)
- CPU核数:建议大于16核
- 内存:建议大于64GB
- 硬盘:建议大于2T
-
建议3:适当调小算子的输入/输出Shape,降低仿真数据量。
-
建议4:请参考Simulator仿真参数设置CAModel仿真参数,如block num建议设置为1。